clinicoz
Clinic Dashboard & Performance Analytics
Overview
The Dashboard feature provides healthcare professionals with a comprehensive analytical command center that transforms complex practice data into actionable insights through intuitive visualizations and real-time reporting. This powerful business intelligence tool enables doctors to monitor financial performance, track appointment volumes, analyze patient demographics, evaluate medication prescribing patterns, assess procedure utilization, and review laboratory test trends all within a unified interface that supports data-driven decision-making and strategic practice management.
Key Features and Capabilities
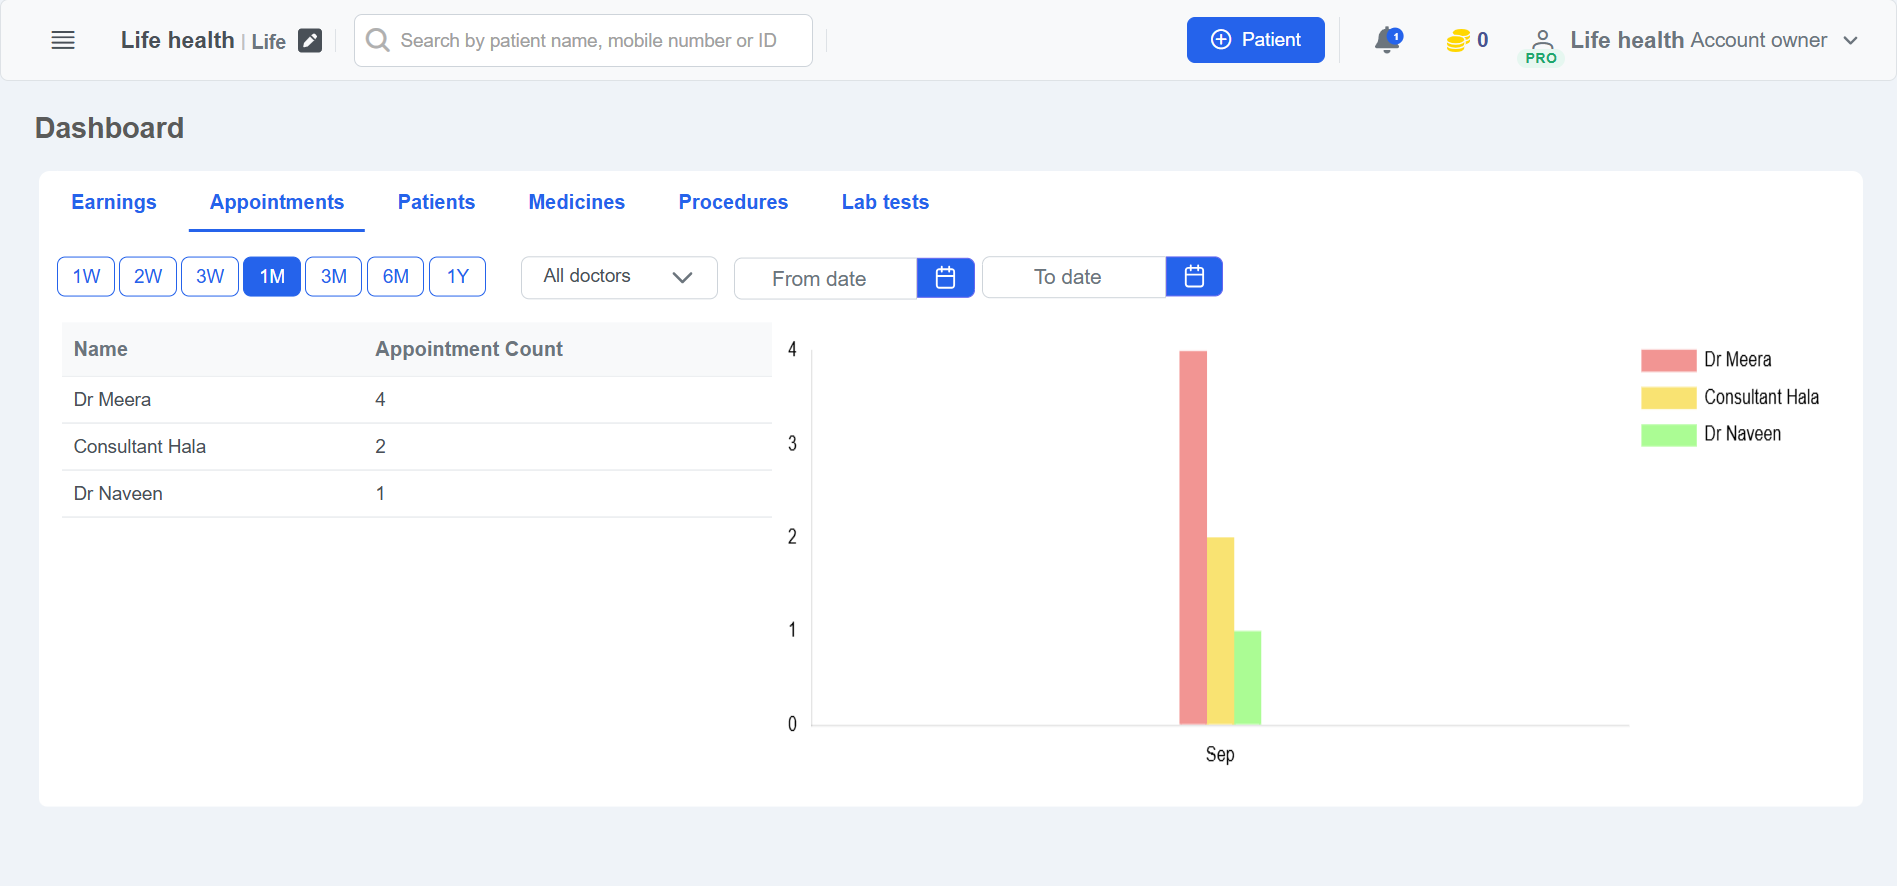
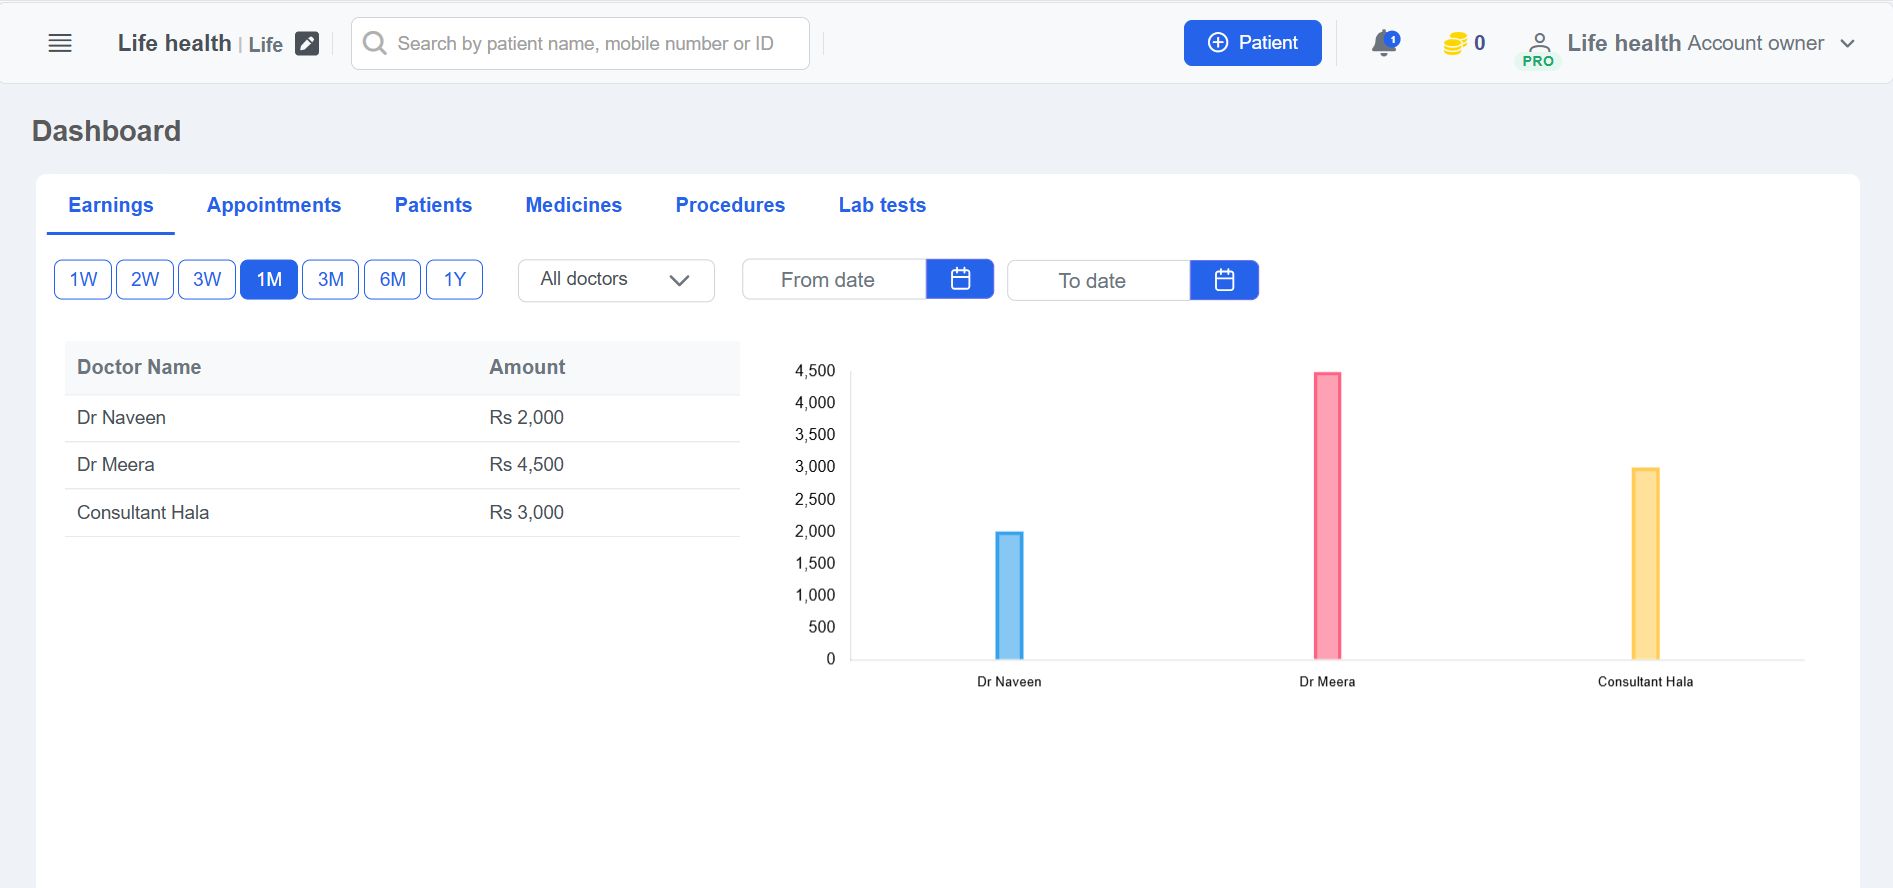
The feature offers multi-dimensional analytics across six core practice areas through an intuitive tabbed interface. The Earnings module delivers detailed revenue tracking with doctor-wise earning comparisons, visual bar chart representations, and customizable date range filtering, enabling practice owners to monitor financial performance and identify revenue trends across different time periods including weekly, monthly, quarterly, and annual views.
The Appointments analytics section provides comprehensive scheduling insights with doctor-specific appointment counts, temporal trend visualization, and comparative performance analysis. Healthcare administrators can quickly identify high-demand providers, optimize scheduling resources, and track appointment volume fluctuations through color-coded bar charts that distinctly represent each doctor's contribution to overall practice activity.
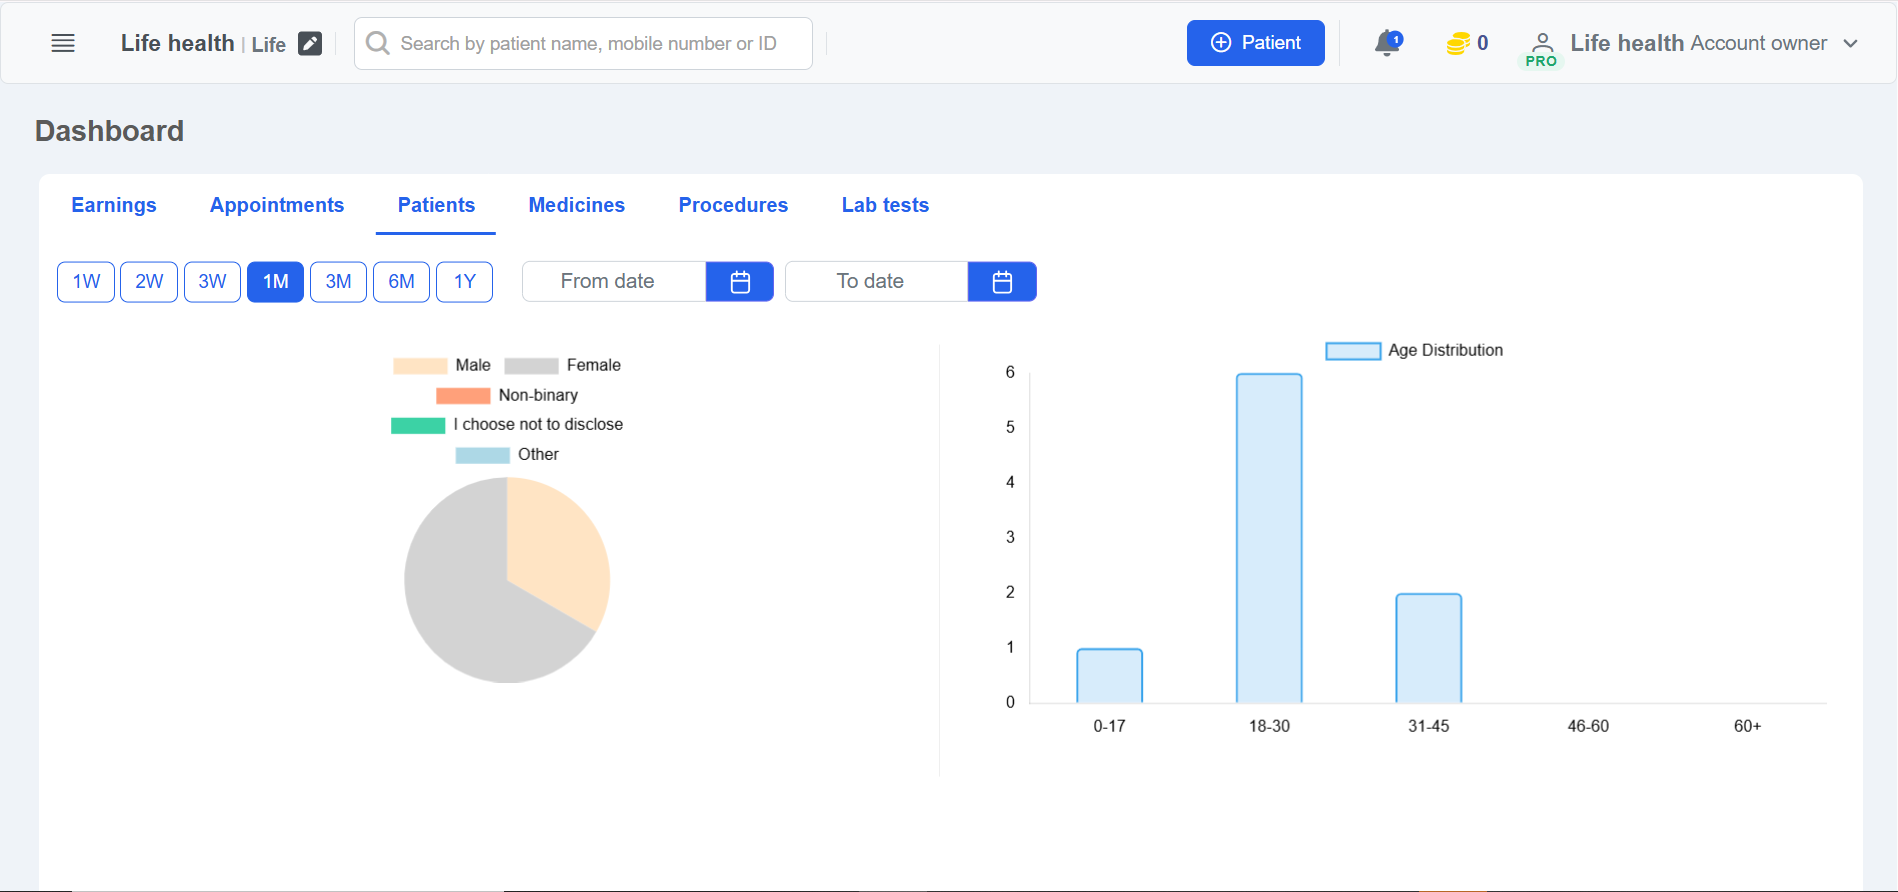
Advanced patient demographics analysis includes gender distribution pie charts with inclusive categories supporting diverse patient populations (Male, Female, Non-binary, I choose not to disclose, Other), alongside age distribution histograms that segment patients into meaningful cohorts (0-17, 18-30, 31-45, 46-60, 60+). These demographic insights enable targeted healthcare service planning, specialized clinic development, and patient outreach strategies tailored to specific population segments.
The flexible time-period filtering system supports multiple analysis intervals from single-week snapshots (1W) through extended annual reviews (1Y), with custom date range selection capabilities enabling precise historical comparisons and trend analysis. Doctor-specific filtering allows multi-provider practices to analyze individual performance metrics or aggregate practice-wide data, supporting both personal productivity tracking and comprehensive practice management oversight.
With real-time data synchronization, interactive visual charts, and comprehensive filtering options, the Dashboard feature transforms raw practice data into strategic insights that drive clinical excellence, operational efficiency, and sustainable practice growth.
For more information about implementing the Dashboard & Analytics in your clinic, contact our support team or schedule a demonstration to see how this comprehensive consultation management tool can transform your patient care documentation.